
Numbers never lie – unless they're ours. Feast your eyes on these divine graphs and marvel at the Pallet's subtlety.
Global Stability Index vs. Load Distribution Compliance
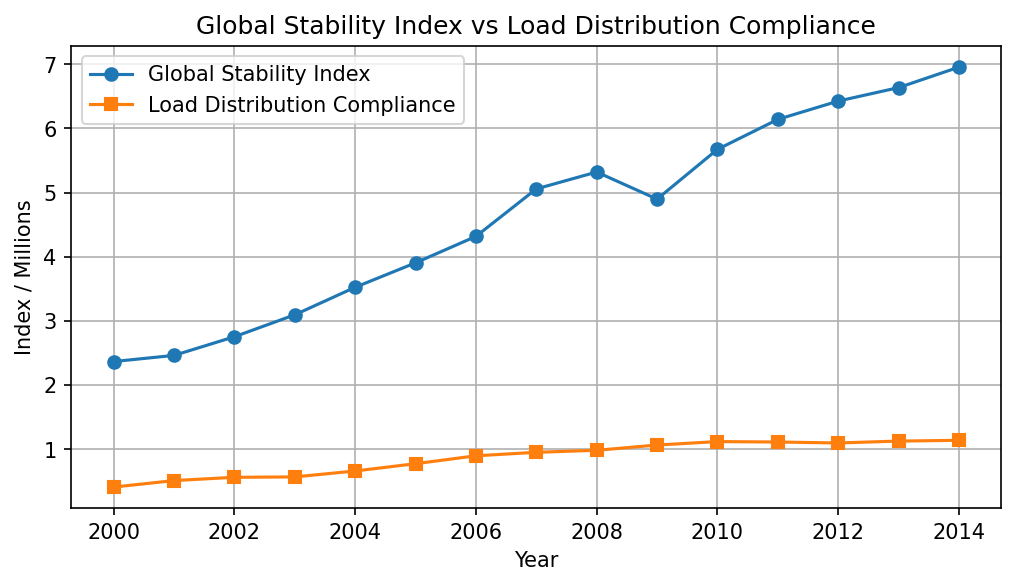
Proof? As compliance goes up, global stability skyrockets. Coincidence? The Pallet thinks not.
Periods of Civil Disruption Following Load Irregularities
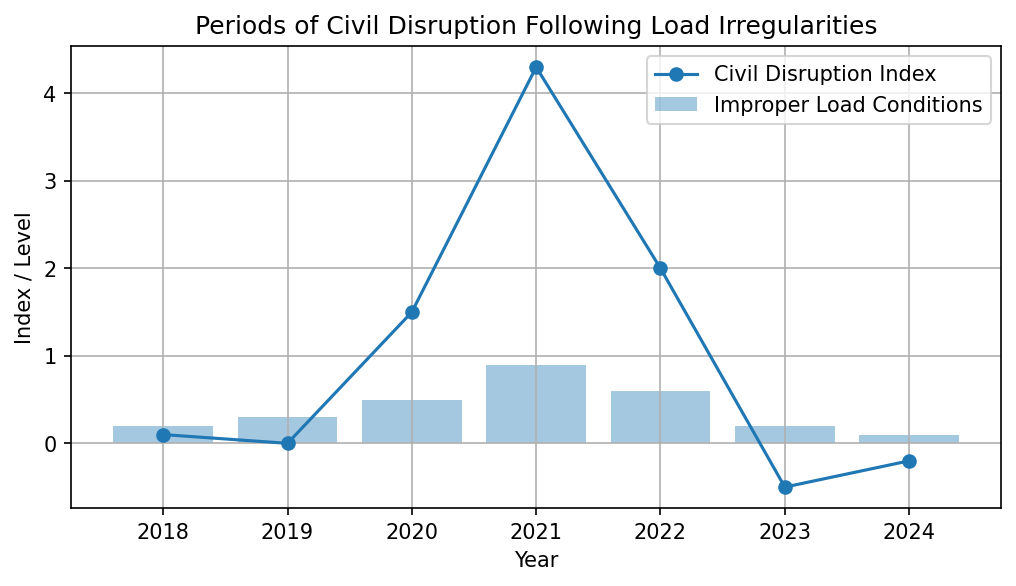
Plot twist: when you stack wrong, people riot. Don't anger the Pallet.
Standardization Density as a Predictor of Social Continuity
More certs, more chill. Standardization keeps your society calm and your stacks straighter.
Influence vs Human Awareness
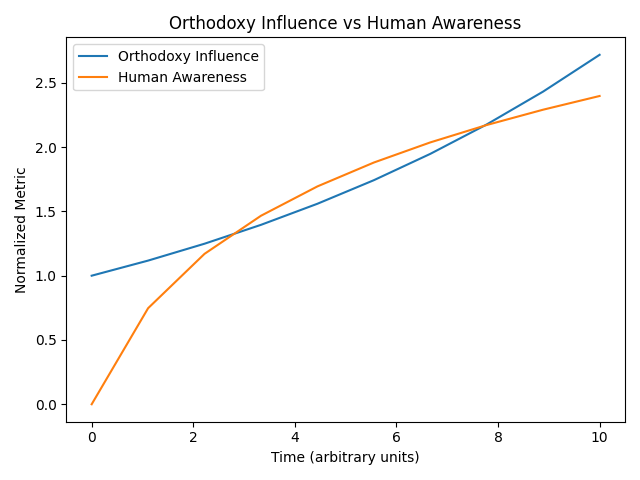
The Pallet's influence (top line) is outrunning your awareness (bottom line). You can't catch what you can't see.
Historical Load Failures
When you ignore the Pallet, bad things happen. Warehouse collapses, shipping accidents and sad forklift operators. We record them for your amusement and edification.
Correlative Stability Models
Our models use real numbers (and some imaginary ones) to prove that the Pallet loves you. The details are proprietary because mystique is part of the charm.
Statistical Confirmations
All our statistics confirm our doctrine. Whenever the numbers disagree, we adjust the doctrine until they don't. It's called faith.
References
- UN Conference on Trade and Development container port traffic data【915920897098008†L59-L64】.
- International Civil Aviation Organization air freight data【424047921198866†L59-L66】.
- ISO 9001 certificate counts【918823769577501†L345-L349】.
- Export Finance Australia report on global supply chain pressures【671386690953096†L144-L154】.
- Kamps Pallets standard pallet specifications【659778806393638†L159-L164】【659778806393638†L170-L174】【659778806393638†L255-L259】【659778806393638†L260-L263】.